To say that we are excited about the new Scatter Chart in the Channel Signal platform would be an understatement. This is one of the most actionable charts in our platform to date, and was created at the urging of one of our most advanced clients. It creates immense value for all Channel Signal users.
What Does the Scatter Chart Show?
The Scatter Chart shows a complete, filterable data set of products with Star Average on the X Axis and Review Volume on the Y Axis. Each brand has a unique marker and can be clicked on and off to further refine. Each dot or mark on the chart represents a single product.
What the Scatter Chart does well is deliver a high-level visual of the landscape in question. This could be five competitors with a complete product set or a specific set of ten products.
Hypothetically, the chart would work like this:
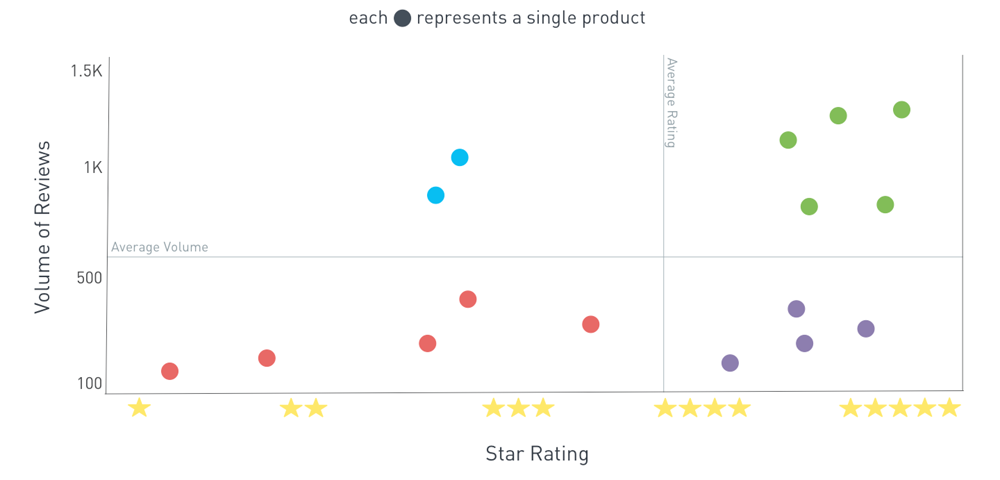
In reality, very few products end up in the upper left quadrant. There’s a simple reason for that. If the reviews are negative, sales are going to be low, so review volume will be low.
The bottom left quadrant will typically have some culprits which should be addressed, but because the volume is low, decisions should be made prudently to ensure the problems aren’t anomalies.
Take a look at an actual Scatter Chart for a competitive set within the Wireless Headphones category for a single month:
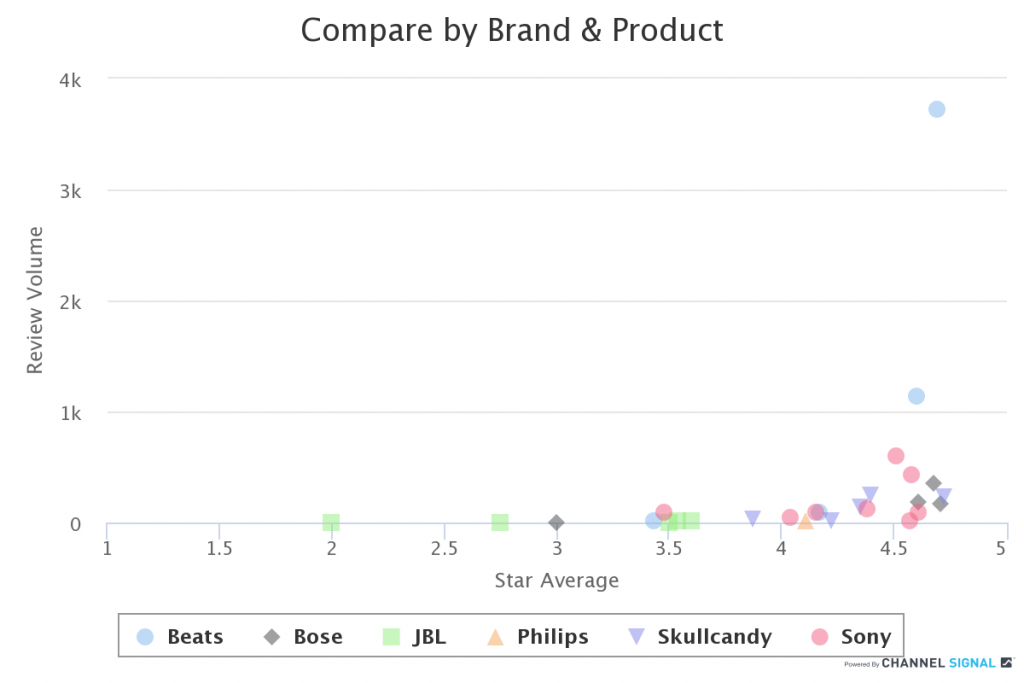
Here we can visualize that JBL has a large number of low rated products, although they have low volume. Beats has the two clear winners in the category. But Bose, Beats and Sony all have individual problem products in the 3-3.5 star range.
What do Brands do with the Information?
Once outliers are identified, the points can be clicked so that further analysis can take place. Products in the upper right-hand corner are the clear winners, and should be pushed. At the same time, products in the lower right-hand quadrant are faring well but don’t have the volume so need addressing.
Then we get to the lower left-hand quadrant. This identifies potentially problematic problems.
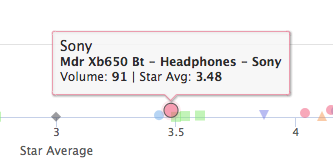
For example, if we click on the problematic Sony product we can see the review breakout for that time period.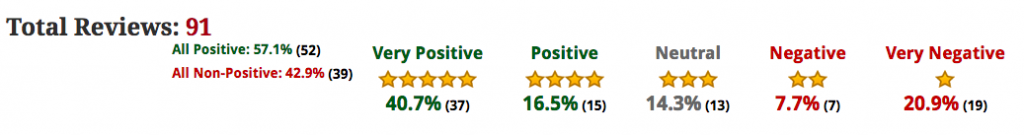
The percentage of positive (4 & 5 star) reviews is quite low for this product by Channel Signal’s cross-industry standard of 82%. Whether I’m an executive at Sony or at one of the competing brands, the next logical question I’d want to answer is why? Why is this product faring so poorly with reviewers?
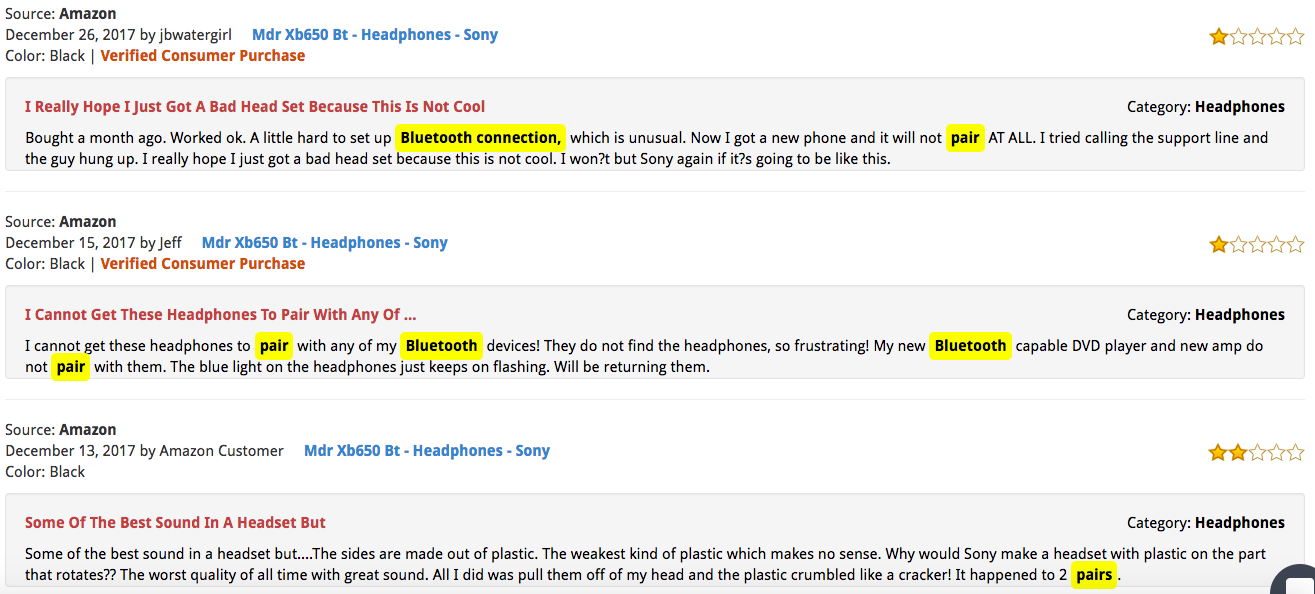
Channel Signal helps answer that question, too. We start by filtering for just the 1 & 2 star reviews and taking a look at the associated review word cloud:
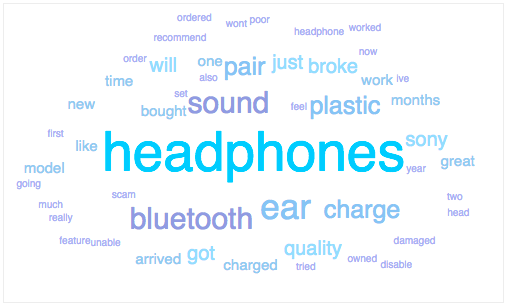
A few key issues come to light:
- Bluetooth/Pairing
- Sound
- Ear
- Plastic
- Charge
If I’m Sony, or Sony’s competitor, I would explore each issue (like the Bluetooth issue, below) to uncover product, messaging and business decisions that can help me stand out in the age of the consumer.